On March 6, 2024, Federal Reserve Chair Jerome Powell delivered remarks before the House Financial Services Committee regarding the Fed’s stance on inflation and the likelihood of rate cuts. In short, rate cuts are coming soon but not too soon. Essentially, the Fed is waiting for more positive inflation data before cutting rates, and cuts will almost certainly come sometime this year. At the start of the year, financial markets were speculating that rate cuts would begin after the Fed’s March meeting, but, with the information from Mr. Powell, we are now expecting rate reductions after the June or July Fed meetings. The Feds strategy makes sense: the benefits of waiting for more information outweigh the potentially negative effects of cutting rates in March only to raise them again in June. The Fed’s dual mandate aims for stable prices (inflation ~2%) and low unemployment. Employment is solid with unemployment at 3.9%, and the February jobs report showed that the labor market added 275,000 non-farm payroll jobs, considerably beating analyst expectations of 200,000. Unless something truly disastrous happens in the labor market, inflation is the primary factor in the Fed’s decision making in the first half of 2024.
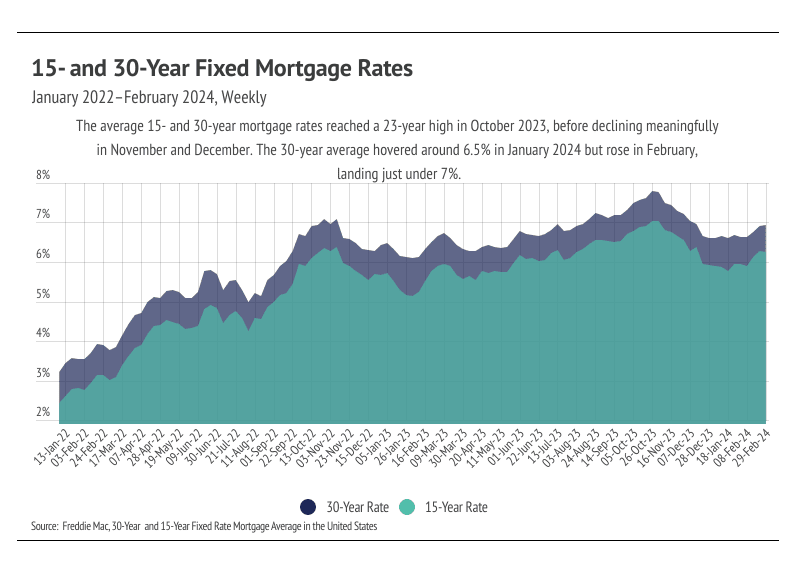
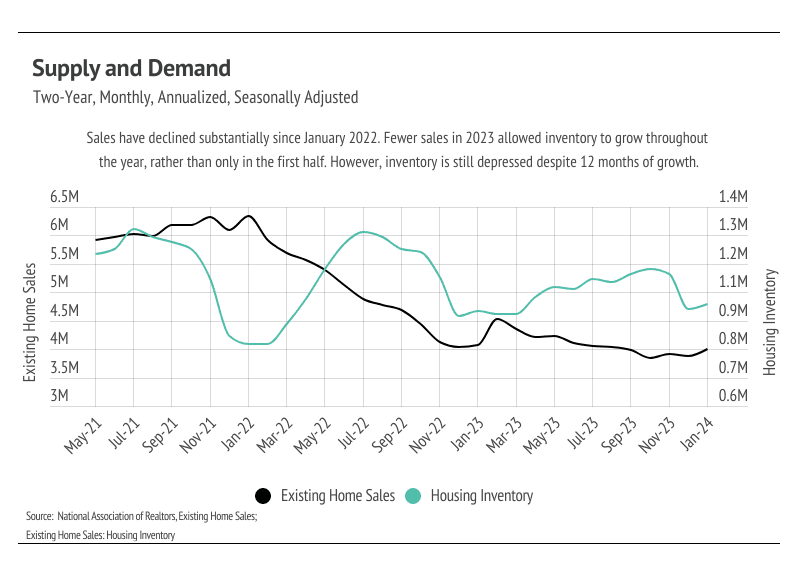
The good news for the housing market is that potential home buyers and sellers have a much clearer picture of where rates will go in the next 12 months. The bad news is that rates likely won’t meaningfully decrease until after what is traditionally the most active time in the housing market (March to August). However, because we know there is a high probability of mortgage rates declining this year, home buyers could easily decide to buy now and refinance in the near future. The average 30-year mortgage rate has been above 6% since September 2022, and the housing market has been slower, especially on the selling side, which of course feeds into the buying side, since buyers can’t purchase what's not for sale. The rate-induced market slowdown has given potential buyers more time for a down payment. Many buyers were priced out of the market in the second half of 2022 but have now had over a year to save more money for a down payment. Buyers and sellers are also a little more accustomed to higher rates so aren’t as emotionally tied to the sub-3% mortgage rates seen in 2020 and 2021. We expect the market to heat up more than it did last year because of these factors and aren't so worried about buyer demand because it’s high relative to supply so more sellers could definitely come to the market.
Different regions and individual houses vary from the broad national trends, so we’ve included a Local Lowdown below to provide you with in-depth coverage for your area. In general, higher priced regions (the West and Northeast) have been hit harder by mortgage rate hikes than less expensive markets (the South and Midwest) because of the absolute dollar cost of the rate hikes and limited ability to build new homes. As always, we will continue to monitor the housing and economic markets to best guide you in buying or selling your home.
Big Story Data

The Local Lowdown — Miami-Dade, Broward, and Orange Counties
-
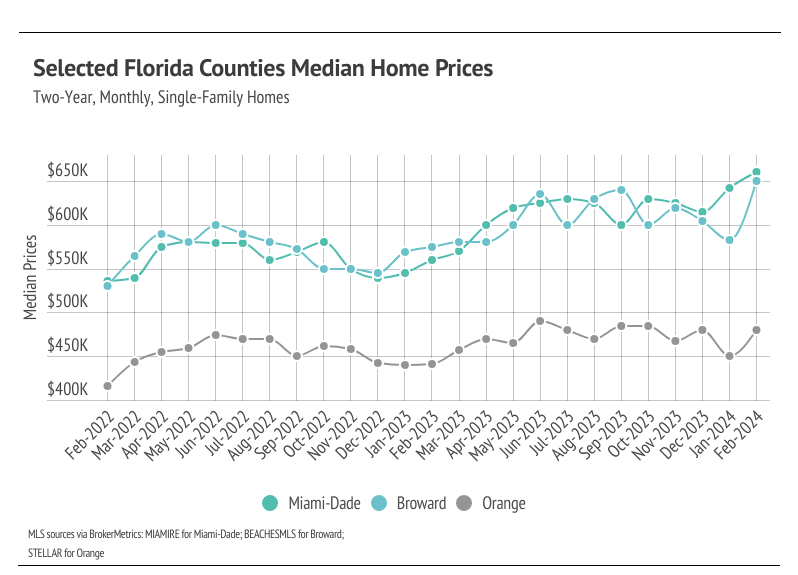
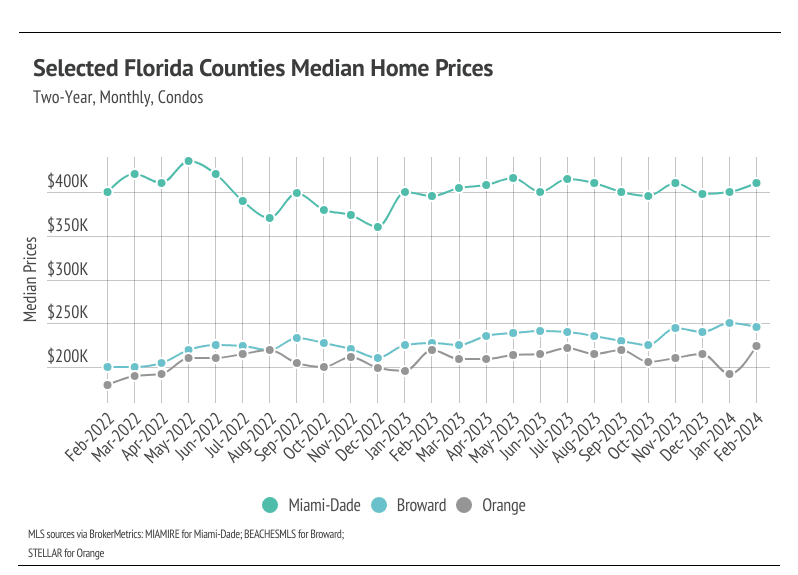
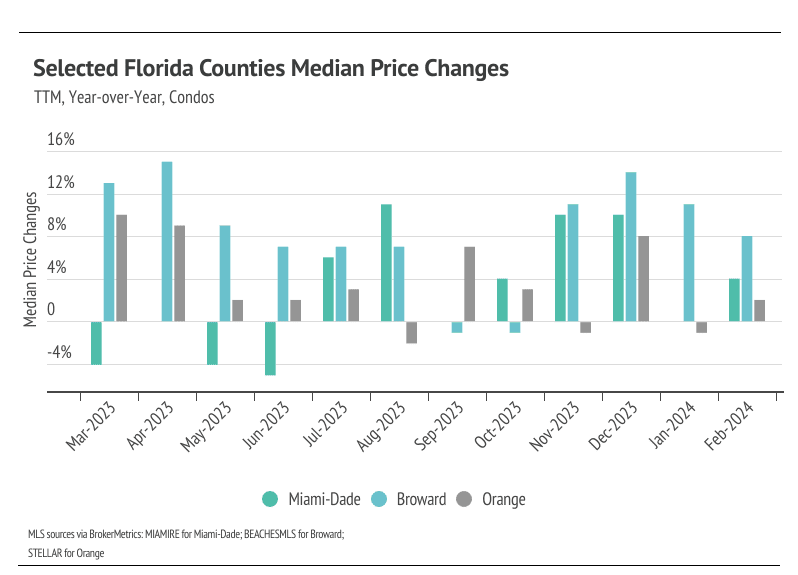
Median home prices rose across the selected markets, even reaching new record highs in Miami-Dade and Broward for single-family homes and Orange for condos.
-
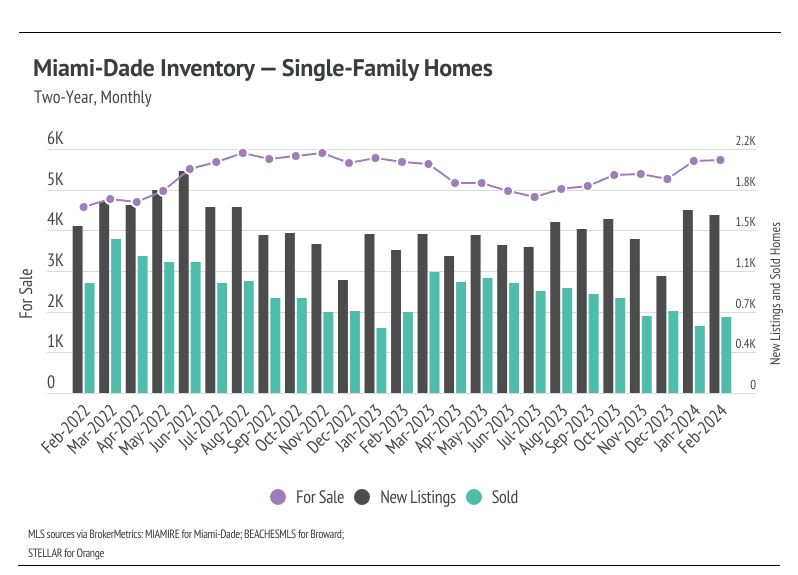
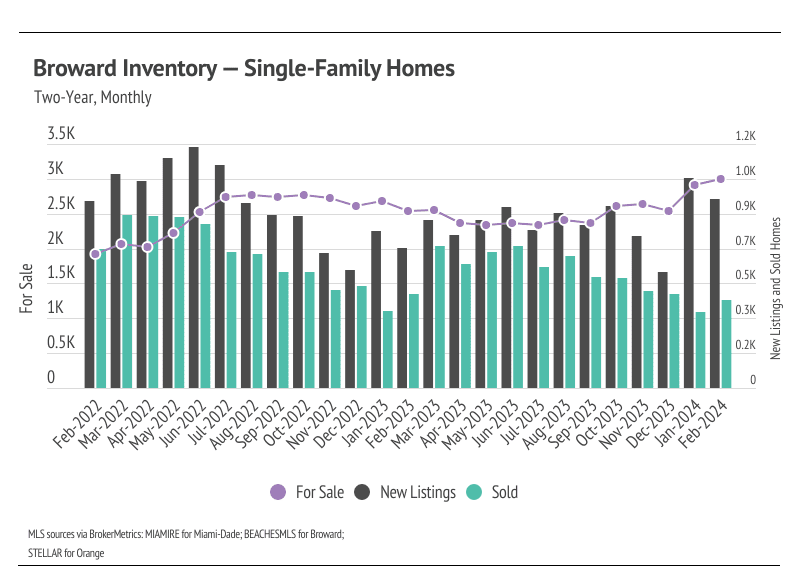
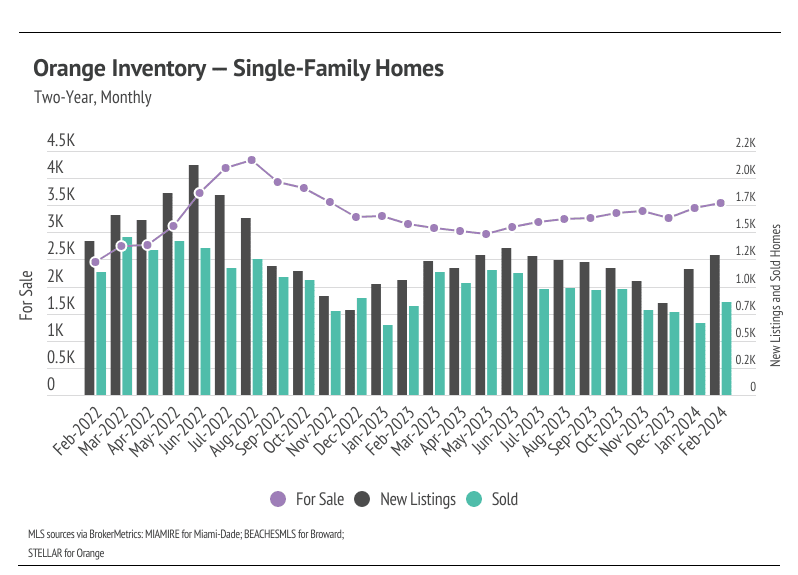
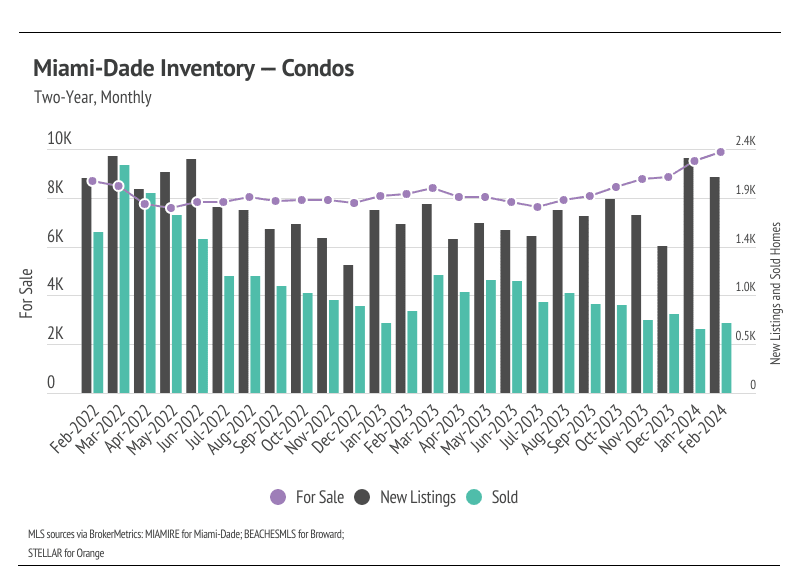
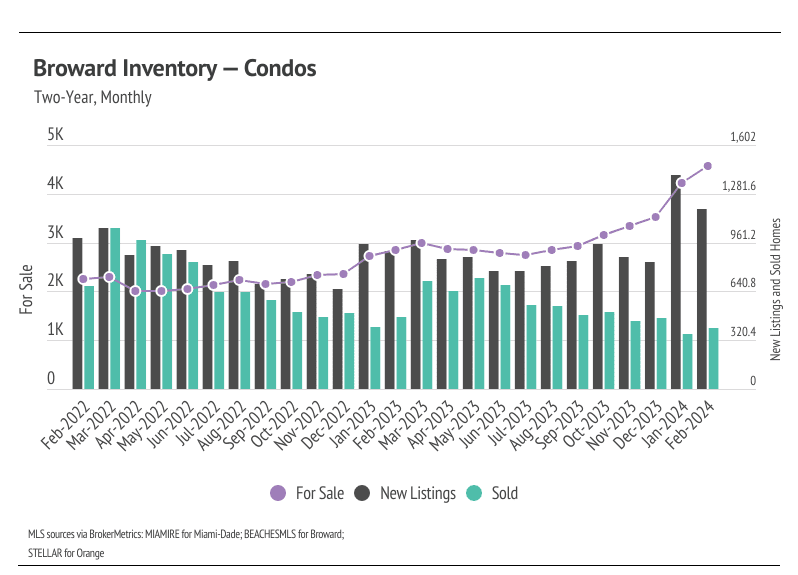
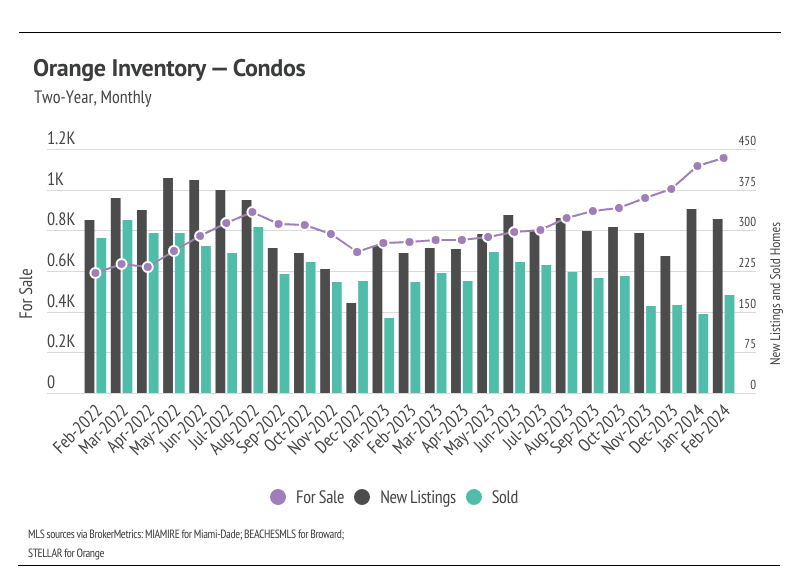
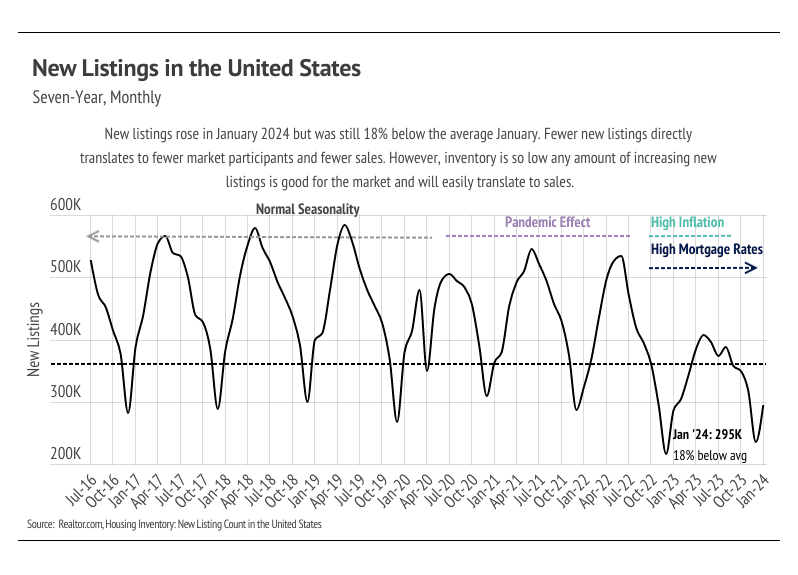
Active listings and sales rose month over month, while new listings declined slightly. Higher supply only benefits the Florida housing markets.
-
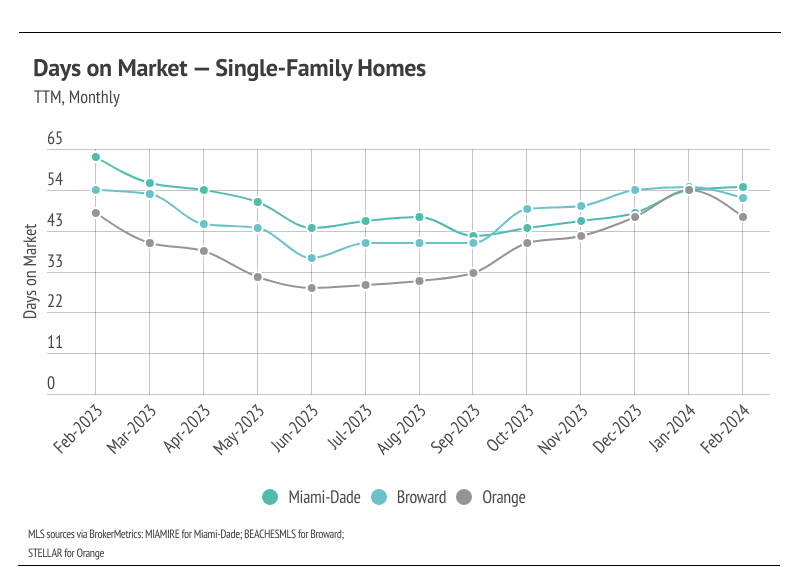
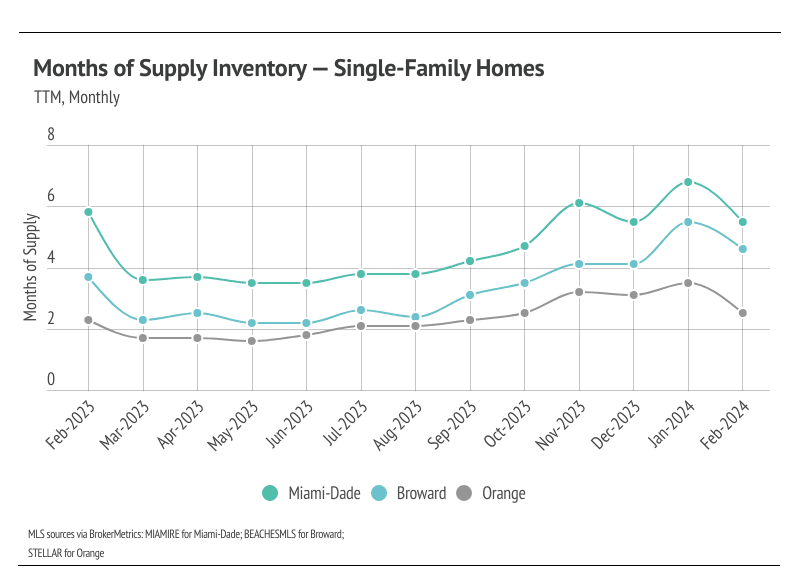
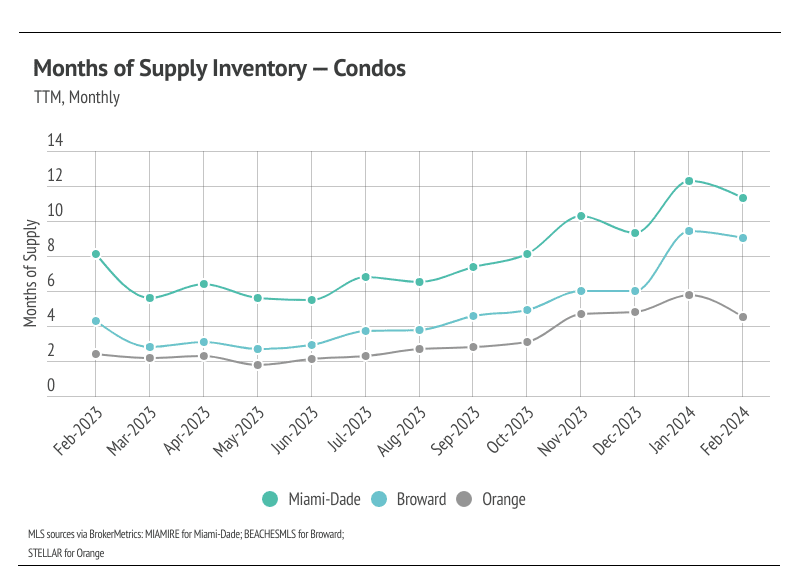
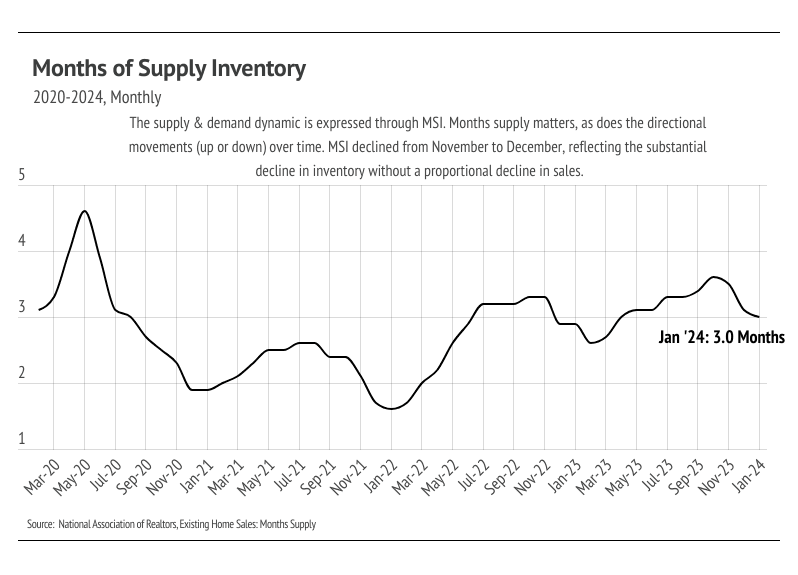
Months of Supply Inventory fell across markets in February 2024. Currently, for single-family homes, MSI indicates a sellers’ market in Orange, a balanced market in Broward, and a buyers’ market in Miami-Dade. For condos, MSI indicates a balanced market in Orange and a buyers’ market in Miami-Dade and Broward.
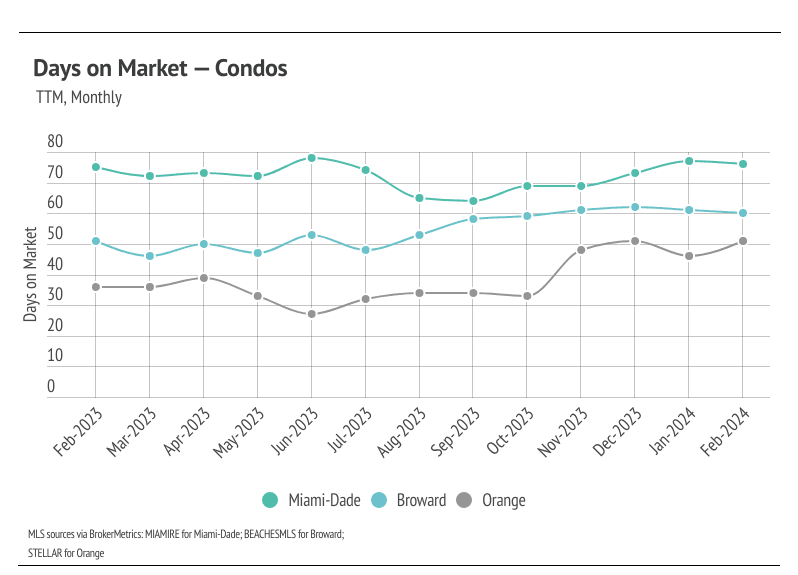
Note: You can find the charts/graphs for the Local Lowdown at the end of this section.
Median single-family home prices in Miami-Dade and Broward, and median condo price in Orange, all hit all-time highs
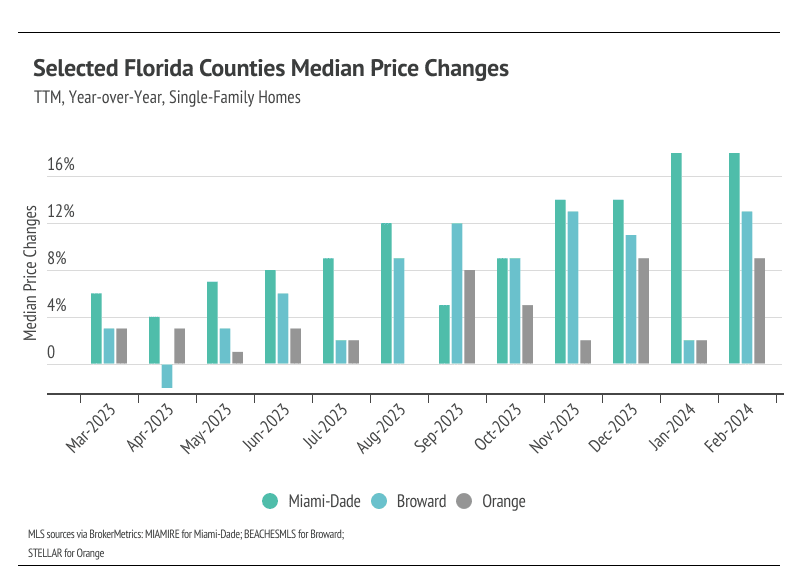
In Florida, home prices haven’t been largely affected by rising mortgage rates — even recently reaching all-time highs during a period of rapidly rising mortgage rates. In February, the median single-family home prices in Miami-Dade and Broward, and the median condo price in Orange, all hit all-time highs. Prices almost never peak in the winter months, indicating home prices will likely rise to a new high in almost every month in the first half of the year. We expect prices to remain slightly below peak in the rest of the selected counties in the winter months, but as interest rates decline, prices will almost certainly reach new highs in the first half of 2024. Additionally, the low but rising inventory and new listings will only raise prices as demand grows. More homes must come to the market in the spring and summer to get anything close to a healthy market, and we are already seeing more new listings come to the market.
High mortgage rates soften both supply and demand, but at this point rates have been above 6% for 15 months, and rate cuts will likely occur sometime this year. Potential buyers have had longer to save for a down payment and will have the opportunity to refinance in the next 12-24 months, which makes current rates less of a limiting factor. However, high demand can only do so much for the market if there isn’t supply to meet it.
Single-family home and condo inventory hit a two-year high across most of the selected markets